AFIS: STUDIES FOR THE FREQUENCY OF APPEARANCES OF FINGER PRINT PATTERNS IN HUMAN FINGERS.
B. Lakshamanan
Inspector of Police (FP) (Spl. Grade) (Ex.)
Tamilnadu Finger Print Bureau, Chennai (India).
First Expert, FPB, FSL, Verna, Goa (India).
Arun G. Bhoi (Forensic Expert)
Assistant Director (Ex.), Directorate of Forensic Science Labs., Mumbai, M. S. (India).
Sr. Scientific Executive, Forensic Science Laboratory, Verna, Goa (India).
Arun’s Institute of Forensic Sciences, Research and Education, Pune (India).
E-mail: arun.bhoi@gmail.com
( e-J. Foren. Crime Inv. 2014, 10-13, 1, Art. 1)
Received On: November, 2013.
Accepted On (Modified): January, 2014.
ABSTRACT
The frequency of patterns of fingerprint impressions was studied using AFIS (Automated Finger Print Identification System). Further, the data obtained was comparatively evaluated with the results of Scotland Yard Committee (1905) and that of Fingerprint Bureau, Calcutta, West Bengal (1953). The differences in the percentage of frequencies of appearances of different fingerprint patterns like arc, loop, whorl etc. are explored, herein, using database of about twenty lakhs of fingerprint impressions.
KEYWORDS
Finger print, impression, pattern, AFIS, arch, loop, whorl, composite.
INTRODUCTION
A team of finger print experts from Scotland yard (1905 ) had conducted a research study to know the percentage of frequencies of finger print patterns of 50,000 impressions from 5000 individuals. Subsequently, during the year 1953, S. K. Chatterjee, Central Finger Print Bureau, Calcutta, West Bengal had also conducted a research experiments to study the percentage of frequencies of finger print patterns among 50,000 impressions from 5000 individuals (Finger, Palm and Sole Prints, 1953, 1st Edition). Here, the frequency of distribution of different finger print patterns formed by ridges, in about twenty lakhs of impressions is explored using database from AFIS – Automated Fingerprint Identification System and was compared with both of the earlier studies.
PROCEDURE Database made available from AFIS was used for the comparative studies of percentage distribution – frequency of finger print patterns in lakhs of impressions.
RESULTS AND DISCUSSION
Scotland Yard Committee set up in 1905 exhaustively studied the 50,000 impressions from 5000 individuals to find the percentage distribution of frequencies of finger print patterns, such as, arch, loops, whorls (Fig. 1) and composites etc.
Figure – 1: Showing finger print patterns (a) Arch, (b) Loop and (c) Whorl.

( a ) Arch

( b ) Loop
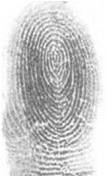
( c ) Whorl
The findings of Scotland Yard Committee (1905) are as reported below in Table– 1.
Table-1: The percentage distribution of frequencies of finger print patterns (1905):
| ARCH |
4.866% |
| LOOPS |
69.696% |
| WHORLS |
20.066% |
| COMPOSITES |
5.372% |
| WHORL + COMPOSITES |
25.4385% |
| AMPUTATED OR INDECIPHERABLE |
0.498% |
The observations of S. K. Chatterjee , Director, Central Finger Print Bureau, Calcutta , West Bengal (1953, Finger, Palm and Sole Prints – 1st Edition) regarding percentage of frequencies of finger print patterns derived from 50,000 impressions of 5000 individuals are cited below in Table – 2:
Table-2: The percentage distribution of frequencies of finger print patterns (1953):
| ARCH |
4.838% |
| LOOPS |
69.414% |
| WHORLS (Including Twinned loop Pattern) |
19.83% |
| COMPOSITES (Excluding Twinned loop Pattern) |
5.486% |
| WHORL + COMPOSITES |
25.316% |
| DAMAGED |
0.42% |
Both these studies revealed almost the same results with the percentage of frequencies of pattern in human fingers. Finger Print Bureaus, all over the world, have accepted results of these studies of the frequency of patterns of human fingers, as reliable. As a matter fact, these studies were based on a very small number of samples i. e. 5000 individual samples, only. However, in this advanced computer era, where it is possible to study any number of finger prints in few seconds, it seems that, no attempts have been made to study frequency of patterns in human fingers, available in lakhs. Hence, efforts have been made to study lakhs of fingerprint patterns to find its frequency in human fingers. More than 2 lakhs of individual samples with a total of 20,01,080 impressions were taken in to consideration through Semi Automated Finger Print Identification System Database for percentage of frequency of finger print patterns in human fingers. The observations are reported in Table – 3.
Table-3: Percentage of frequency of Finger Print patterns (AFIS)
| ARCH |
2.235% |
| LOOPS |
55.816% |
| WHORLS |
30.245% |
| COMPOSITES |
10.285% |
| WHORL + COMPOSITES |
40.530% |
| SCAR |
1.259% |
| AMPUTATED |
0.177% |
Apart from analysis of 20,01,080 finger impressions through Semi Automated Finger Print Identification System Database from one of the States and 2099290, 3795317, 1187433 finger impressions from other States, wherein AFIS/FACTS installed were also, considered for the studies. The distribution of percentage of frequency of fingerprint patterns in human fingers in total number of 20,99,290 impressions was observed as in Table – 4.
Table-4: Percentage distribution of fingerprint pattern in 20,99,290 impressions.
| ARCH |
3.358 % |
| LOOPS |
52.543% |
| WHORL + COMPOSITE |
38.253% |
| SCAR |
6.350% |
| NONE |
0.846% |
Table – 5 shows the results of percentage of frequency of finger print pattern in human finger in 37,95,317 impressions.
Table-5: Percentage distribution of fingerprint pattern in 37,95,317 impressions.
| ARCH |
3.607% |
| LOOPS |
58.277% |
| WHORL + COMPOSITE |
38.068% |
| SCAR |
0.046% |
Results of percentage of frequency of finger print pattern in human finger in a total sample impressions 11,87,433 are detailed in Table- 6.
Table-6: Percentage distribution of fingerprint pattern in 11,87,433 impressions.
| ARCH |
3.376% |
| LOOPS |
56.984% |
| WHORL + COMPOSITE |
39.563% |
| SCAR |
0.074% |
The average distribution of total of above 70,82,040 finger print patterns in human fingers (2006) is tabulated in the following Table – 7 :
Table-7: Percentage distribution of frequencies of fingerprint patterns (2006)
| ARCH |
3.319% |
| LOOPS |
56.35% |
| WHORL + COMPOSITE |
39.232% |
| SCAR |
1.919% |
| None |
0.02% |
In AFIS no separate icon is considered for composite pattern except that of accidental. Hence, the above tables does not disclose the percentage of frequencies for composite pattern. Hence, the distribution of 20,01,000 fingerprint impressions explored above (Table – 3), the percentage of occurrence for composite pattern comes around 10.285%. If this percentage (10.285%) has been taken into consideration and applied to a total of the fingerprint impressions studied by deducting the same from the calculated ‘Whorl’ percentage the final tally of frequency of finger print pattern should be as in Table – 8.
Table – 8: The final tally of frequency of finger print pattern (Modified)
| ARCH |
3.319% |
| LOOPS |
56.35% |
| WHORL |
28.947% |
| Composite |
10.285% |
| SCAR |
1.919% |
| None |
0.02% |
The findings of Scotland Yard team (1905), 1953 studies and that of AFIS (2006) are comparatively, depicted in Table – 9.
Table – 9: Inter comparison of the three distribution calculations:
| Sr. No. |
Finger Print Pattern |
Distribution (%) based on findings of Scotland yard Expert committee (1905) (50,000 impressions) |
Distribution based on studies of Sh. Chatterjee, West Bengal (1953) (50,000 impressions) |
Distribution based on AFIS(2006) ( 70,82,040 impressions). |
|
(1)
|
(2)
|
(3)
|
(4)
|
| 1 |
Arch |
4.866%
|
4.838%
|
3.319%
|
| 2 |
Loop |
69.696%
|
69.414%
|
56.35 % |
| 3 |
Whorl |
20.066%
|
19.83 % |
28.947%
|
| 4 |
Composite |
5.372%
|
5.486%
|
10.285%
|
| 5 |
Scar |
0.438%
|
0.42 % |
1.919%
|
| 6 |
None |
—
|
|
0.02 % |
An analysis of the above three studies reveals that, the percentage of Arch pattern was nearly 4.8% in both the studies of 1905 and 1953. Whereas, it is only 3.319% based on the AFIS studies i.e. 1.5% less than the former two studies. Since, the AFIS study was made among 70,82,040 impressions, it is put forth that, the AFIS may be relied on and hence the chances of occurrence of Arch Pattern including Tented arch pattern in human finger impressions should be considered as 3.319% .
As far as, loop is concerned both the studies predicted a frequency of about 69%, whereas, the AFIS study reveals the frequency of loop pattern 56%, only. This shows a reduction of about 13 % in percentages of appearances of loop pattern as observed in 1905 and 1953 studies.
In case of whorl, the earlier two studies estimated its presence as 20%, whereas, the AFIS studies revealed an increase of 8%.
Existence of composite pattern is about 5% as reflected in 1905 and 1953 findings. However, the study through semi-automated finger print identification system (NCRB) revealed it as 10.285% resulting in increase of about 5% to that of earlier studies.
CONCLUSION
The results discussed above are based on studies of 70,82,040 sample finger print impressions using computerized AFIS, therefore, it claims to be accepted for the frequency of appearances / distribution of finger print patterns in human fingers. These studies have been extended to find match for the chance print in a minimal time with suggestive changes in AFIS, specifically, concentrating on studies of loop, whorl and ridge counts.
ACKNOWLEDGEMENTS
Author’s thanks are due to the Heads of Institutions, FPBs.


Written by Arun Bhoi
on December 13, 2012
11 Comments