SEMI – QUANTITATIVE DETERMINATION OF ANTHRACENE USING TLC.
ARUN BHOI, Forensic Expert
(Former Head of Division, Directorate of Forensic science Laboratories, State of Maharashtra (INDIA) and Former Senior Scientific Executive and OSD, Goa State Forensic Science Laboratory, Goa (INDIA)
e- J. Foren. Crime Inv. 2021, 23-35, 1, Art. 1.
ABSTRACT
In India, Anthracene powder has a great concern with the bribery cases. Therefore, TLC method has been described to analyse anthracene semi – quantitatively. Thin-layer chromatography with sulphanilic acid chromogenic reagent was used for this purpose. The Beer’s law obeyed good for the quantities in the range of ’05 μg to 50 μg’ of anthracene.
KEY WORDS
Anthracene, TLC, thin layer chromatography, Anthracene determination, Tetracene
INTRODUCTION
A chemical substance ‘Anthracene’ powder is a good tool in the hands of the police personnel attached to the ‘Anti-corruption Bureau’ to catch hold of the culprit, a bribe receiver. The Anthracene powder has been applied to the currency notes and/or relevant articles concerned with the bribery cases. In the process of planned bribe transaction trap, as soon as the money or so has been accepted by the receiver the applied powder gets transferred to his hands. If the money has been accepted and put in a pocket or handkerchief or table drawer, etc. the Anthracene powder falls on or adheres to the surfaces came in contact. Then the relevant articles and powder particles have been collected and seized by the anti-corruption bureau officials for the forensic examination and to ascertain the presence of the powder on the hands and clothes of the culprit and at the places where the currency notes have been put. It necessitates the forensic expert to detect the presence of the anthracene and to determine its quantity found.
The anthracene powder can be seen as a blue-violet fluorescence under ultra-violet light (1). The impurity of tetracene associated with anthracene is observed as yellow particulates with greenish fluorescence (2, 3). Ultra-violet spectroscopy has been used to obtain data for pure anthracene (4, 5). Thin – layer Chromatographic methods (6, 7) explain the separation of constituting impurities present in commercial anthracene. Bhoi, et. al. have carried out the forensic examination of anthracene traces on seizers in anti – corruption offence by TLC, UV and GLC techniques (8). Herein, the TLC technique described by Bhoi, et. al. (8) has been adopted to determine the anthracene semi- quantitatively.
EXPERIMENTAL
Reagents
All solvents and reagents used were of AR Grade. Glass distilled water, ethyl alcohol (95%) were used wherever required.
Sulphanilic acid diazo – salt chromogenic reagent (0.2%)
This reagent was prepared by adding equal quantities of 0.2 % sulphanilic acid solution in 1N HCl and 0.3 % aqueous solution of sodium nitrite and allowing the mixture to set for half an hour (9).
Standard anthracene solution
The standard anthracene solution was prepared by dissolving 5 mg of anthracene in 5 ml of ethyl alcohol (95%) in a stoppered 5 ml capacity measuring cylinder.
PROCEDURE
Thin Layer Chromatography
A clean TLC plate of the size of 10 cm x 20 cm was taken. It was coated with the slurry of Silica Gel G (E. Merck) (1:2 w/w, SGG:Water) to the thickness of 0.25 mm and activated to a temperature 110⁰c for an hour. The quantities 5, 10, 20, 30, 40 and 50 μg of standard anthracene equidistantly spotted on the activated TLC plate, 1.5cm above the bottom edge. The TLC chamber containing 100 ml of chloroform as a developing solvent kept for saturation in a dark room for half an hour. The anthracene spotted TLC plate was then carefully placed in a TLC chamber and was allowed to get developed for 10 cm from the spot line. Then, the plate was immediately removed and allowed to get dried at room temperature.
Dried plate was sprayed with the chromogenic reagent, diazo – salt of sulphanilic acid formed by intermediate reaction of sodium nitrite solution (aqu.) and acidic solution of sulphanilic acid. Thereafter the sprayed plate was heated for 10 – 15 minutes in an oven pre-adjusted at 110⁰C temperature. The prominent bluish-violet spot/s (Fig. -1) were observed for the standard anthracene at Rf-value 0.76 ± 0.03. The shape of the spot was roundish – oval.
Purity check
The separate TLC experiment was carried for knowing the purity of anthracene samples available at the hand. The greenish spot observed at Rf-value 0.88 ± 0.03 was accounted for tetracene which could have come as an impurity with anthracene (Rf-value 0.76 ± 0.03) in commercial sample. The Figure -1 shows developed spots for (A) Commercial anthracene, (B) Random anthracene sample and (C) Standard anthracene sample used for semi – quantitative determination.

Figure – 1: The coloured developed spots observed on TLC for (A) Commercial anthracene,
(B) Random anthracene sample, (C) Standard anthracene.
Measurement of areas of respective spots
For the semi – quantitative determination of anthracene the TLC experiment was carried out as described above. The respective spot developed for 05, 10, 20, 30, 40 and 50 microgram quantities of standard anthracene are shown in Figure – 2.
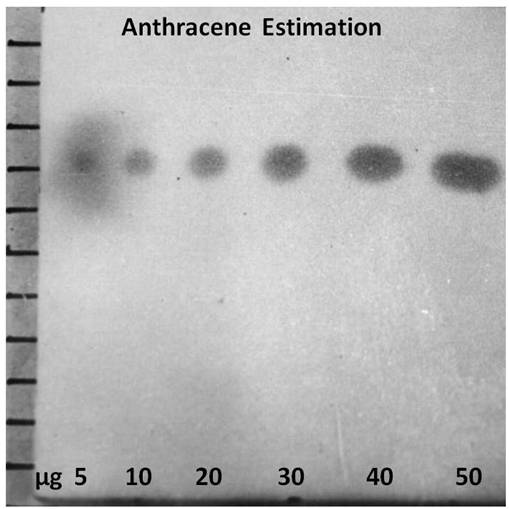
Figure – 2: (Black and White Image): Spots developed for 05, 10, 20, 30, 40 and 50 microgram quantities of standard anthracene.
The experiment was carried out in four sets. The areas of every spot were carried out using the mathematical equation ‘’. The diameters ‘D1 and D2’ of every spot assigned for 05, 10, 20, 30, 40 and 50 microgram were measured and from that, respective radii ‘r1’ and ‘r2’ were found out. By using above equation for every spot from all the four sets, spot areas were calculated. The findings have been depicted set-wise as below:
SET – I
| Quantity Spotted (μg) | Diameter – 1 (mm) | Diameter – 2 (mm) | Radius – 1 (mm) | Radius – 2 (mm) | Area of Spot (mm2) |
| 05 | 5.0 | 6.0 | 2.5 | 3 | 23.6 |
| 10 | 6.0 | 7.5 | 3.0 | 3.25 | 30.6 |
| 20 | 8.0 | 11.0 | 4.0 | 5.5 | 69.1 |
| 30 | 8.0 | 13.0 | 4.0 | 6.5 | 82.7 |
| 40 | 9.0 | 15.0 | 4.5 | 7.5 | 106 |
| 50 | 9.0 | 18.5 | 4.5 | 9.25 | 130.8 |
SET – II
| Quantity Spotted (μg) | Diameter – 1 (mm) | Diameter – 2 (mm) | Radius – 1 (mm) | Radius – 2 (mm) | Area of Spot (mm2) |
| 05 | 5.0 | 6.0 | 2.5 | 3 | 23.6 |
| 10 | 5.5 | 8.0 | 2.75 | 4.0 | 34.6 |
| 20 | 8.0 | 11.0 | 4.0 | 5.5 | 69.1 |
| 30 | 8.5 | 12.0 | 4.25 | 6.0 | 80.1 |
| 40 | 8.5 | 15.0 | 4.25 | 7.5 | 100.2 |
| 50 | 9.0 | 18.5 | 4.5 | 9.25 | 130.8 |
SET – III
| Quantity Spotted (μg) | Diameter – 1 (mm) | Diameter – 2 (mm) | Radius – 1 (mm) | Radius – 2 (mm) | Area of Spot (mm2) |
| 05 | 5.0 | 6.5 | 2.5 | 3.5 | 25.5 |
| 10 | 5.5 | 8.0 | 2.75 | 4.0 | 34.6 |
| 20 | 7.0 | 10.5 | 3.5 | 5.25 | 55.32 |
| 30 | 8.0 | 13.0 | 4.0 | 6.5 | 81.7 |
| 40 | 9.0 | 15.0 | 4.5 | 7.5 | 106 |
| 50 | 9.0 | 18.0 | 4.5 | 9.0 | 127.3 |
SET – IV
| Quantity Spotted (μg) | Diameter – 1 (mm) | Diameter – 2 (mm) | Radius – 1 (mm) | Radius – 2 (mm) | Area of Spot (mm2) |
| 05 | 4.5 | 7.0 | 2.25 | 3.5 | 24.7 |
| 10 | 5.5 | 8.5 | 2.75 | 4.25 | 36.7 |
| 20 | 6.5 | 10.0 | 3.25 | 5.0 | 51.1 |
| 30 | 8.0 | 12.5 | 4.0 | 6.25 | 78.6 |
| 40 | 8.0 | 14.0 | 4.0 | 7.0 | 88 |
| 50 | 10.0 | 17.0 | 5.0 | 8.5 | 133.5 |
From the areas of the respective spots obtained and mentioned in the last column of SET – I, SET – II, SET – III and SET – V, the average area for every spot viz. 05, 10, 20, 30, 40 and 50 microgram quantities of standard anthracene are tabulated as below in Table -1.
| Quantity of Anthracene Spotted (μg) | Average Area of Spot (mm2) from SET- I, II, III, IV |
| 05 | 24.4 |
| 10 | 34.1 |
| 20 | 61.2 |
| 30 | 80.8 |
| 40 | 100.1 |
| 50 | 130.6 |
Table – 1: Showing microgram quantities of standard anthracene spotted and eluted on TLC and its respective average areas of four sets.
Calibration Graph: Calibration Equation: Correlation Coefficient
The calibration graph for determining the presence of anthracene semi – quantitatively, the values of quantity of anthracene applied on TLC and its respective average area calculated and mentioned at Table – 1 were taken into consideration for obtaining the calibration curve. The computer program was used for the same and to get the calibration equation, as also, the correlation coefficient. The details of these are as shown below in Figure – 3. The X-axis represents the quantities of anthracene and Y-axis represents corresponding average areas of the spot.

Figure – 3: X-axis and Y-axis showing microgram quantities of anthracene applied on TLC and corresponding average areas of spot (mm2), forming a straight line calibration curve.
RESULTS AND DISCUSSION
The TLC technique described here helps to detect and identify anthracene obtained from variety of sources. It does helps to detect impurities like tetracene coming with anthracene. Diazo-salt of sulphanilic acid plays better role for it, which imparts prominent bluish-violet colour to anthracene located at Rf-value 0.76 ± 0.03. Calibration graph obtained is linear and Beer’s law has been followed nicely, in the range of 05 μg to 50 μg of the anthracene used for spotting. The calibration equation found to be, ‘y= 2.305x + 12.31’ and the correlation coefficient is ‘0.995’. The data used here is a pretty old. However, the technique described could detect 1 μg quantity of anthracene. The method may also find its role to detect anthracene semi-quantitatively, in/on desired samples.
ACKNOWLEDGEMENT
Authors thanks are due to, Director, Directorate of Forensic Science Laboratories, Mumbai, M. S., INDIA.
REFERENCES
- The Condensed Chemical Dictionary, Arthur and Elizabeth Rose, 1966.
- Allen’s Commercial Organic analysis, Vol. III, Fourth Edition, J and A Churchill, London, 1910, P-273, 277.
- Merck Index, Eighth edition, Merck and Co., Inc. U. S. A., 1976.
- Ultra-violet and Visible Spectroscopy, Chemical Applications, Second Edition, C. N. R. Rao, 1967, p- 71.
- Organic Electronic Spectral Data, Vol. I, Mortier J. Kamlet, Inter Science Publishers Ltd., New York, London, 1946-1952, p- 548.
- Thin –layer Chromatography, A Laboratory Hand Book, Edited by Egon Stahl, Second Edition, Springer International Student Edition,, New York, 1969, p- 668-669.
- Kurtt Randerath, Thin Layer Chromatography, second Revised and Enlarged Edition, Translated by D. D. Libman, 1966, p- 262 -264.
- A. G. Bhoi and K. A. Ambade, Journal of Indian Academy of Forensic Sciences, 1991, 30 (1), p-19-26.
- Allen’s Commercial Organic analysis, Vol. III, Fourth Edition, J and A Churchill, London, 1910, P-137 – 140.

Written by accurateforensics
Leave a comment