Archive for March, 2011

Spectrophotometric Determination of Pyridine in Denatured Spirits

Arun G. Bhoi

Arun’s Institute of  Forensic Sciences, Research and Education, Pune  – 411028, State of Maharashtra, (India).

Email : arun.bhoi@gmail.com

(e-J. Foren. Crime Inv. 2011, 1, 1. Art. 3, 26th Jan. 2011)

ABSTRACT

The rectified spirit (ethyl alcohol) is intentionally denatured using denaturants like caoutchoucine, pyridine, crystal violet, denatonium saccharide, some aldehydes and petroleum hydrocarbons for specific use or to avoid its misuse. A spectroscopic method is reported here for the determination of pyridine in denatured spirit samples (DNS). The spirit samples containing pyridine are allowed to react with tri-chloroacetic acid in the presence of sodium hydroxide at 85˚c temperature for 75 minutes. The absorbance of the crimson colour produced is measured at λ-max 362 ± 1 nm. Bear’s law is found in the range of 275μg to 1472 μg. The other denaturants present in the denatured spirit samples do not interfere.

KEY WORDS : pyridine, denatured spirit, denaturant, sodium hydroxide, tri-chloroacetic acid.

INTRODUCTION

Various miscible denaturants such as acetaldehyde, acetone, caoutchoucine, formaldehyde, acetaldehyde, crotonaldehyde, ethyl acetate, ether, methanol, chloroform, pyridine, petroleum hydrocarbon solvent etc. are added to rectified spirit to make the later unfit for human consumption. Usually 0.5% (v/v) of pyridine bases are added to rectified spirit to make it non-potable. Many of the methods like gas chromatography [1,2], spectrophotometry [3-6], titremetry [7] and thin-layer chromatography [8] are reported in the literature for determination of pyridine.

The spectrophotometric method using tri-chloroacetic acid in alkaline condition is described here for the determination of pyridine.

EXPERIMENTAL

Equipments :

A Shimadzu  double beam ultra violet / visible spectrophotometer and a matching pair of quartz cells were used for the absorbance measurements.

Reagents :

All reagents used were of Analytical Reagent grade. Glass distilled water was used throughout the experiment. 95 % ethyl alcohol was used as and when required.

  1. Sodium hydroxide solution (10%) : 10 g of sodium hydroxide palettes were dissolved in small quantity of distilled water and made up to 100 ml with the same.
  2. Tri-chloroacetic acid solution (1%) : 1 g of tri-chloroacetic acid was dissolved in distilled water and made up to 100 ml.
  3. Standard Pyridine solution (1 %)  : Pyridine ( 1 ml ) was dissolved in 95% of ethyl alcohol and was made up to 100 ml.

Procedure :

Exact quantities ( ml ) of standard pyridine solution such as 0.3, 0.6, 0.9, 1.2 and 1.5 ml equivalent to 294, 588, 883, 1177 and 1472  μg  respectively, were taken in separate reaction/test tubes. Distilled water was added to each of these to make the total volume 3 ml. For blank 3 ml of distilled water was in one additional test tube. Then 2 ml of 10 % sodium hydroxide solution and 5 ml of 1 % tri-chloroacetic acid solution was added to each of these reaction tubes. The water bath was adjusted to 85˚c approx. and all the above reaction tubes were kept in the water bath for 75 min. The temperature of water bath was regulated to 85˚c during the reaction time. Afterwards the tubes were taken out and allowed to stand for half an hour. Then the absorbances of the crimson color developed were measured at λ-max 362 ± 1 nm using blank reagent as reference with the help of double beam Shimadzu ultraviolet – visible spectrophotometer and matching pair of quartz cells.

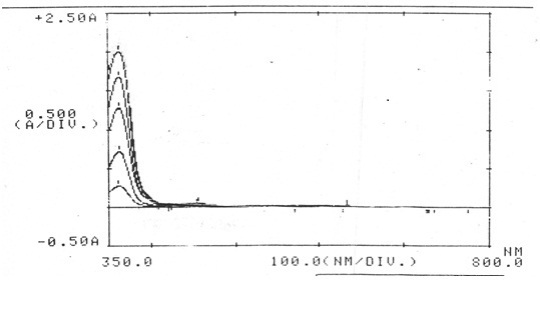
Figure 1 : Showing absorbance spectra of colour developed for Pyridine  Standard 1 to Standard  5    (λ-max 362±1 nm).

TABLE 1 : Showing Concentrations of Standard Pyridine /10ml and its corresponding Absorbances

StandardNo. Concentration of Std. Pyridine per 10 ml Absorbance (Av. of two)At λ-max 362 ±1 nm
ml of 1% Std. Pyridine Equivalent μg of Pyridine
1 0.30 294 0.266
2 0.60 588 0.670
3 0.90 833 1.099
4 1.20 1177 1.594
5 1.50 1472 1.960

RESULTS AND DISCUSSION

Fig. 1 shows the absorbance spectra of the crimson color developed. The absorbances with corresponding concentrations of pyridine are recorded in Table – 1.  The calibration curve of absorbance versus respective concentration of pyridine is shown in Fig. 2.  Beer’s law is obeyed good in the range of 275 μg to 1472 μg per 10 ml. The calibration equation for this is “ Y = 0.001x – 0.158” and “correlation coefficient = 0.997”. Other denaturants such as acetone, aldehydes, methanol, chloroform, pyridine,  ethylacetate, ether etc. did not interfere in the determination of the pyridine. Thus, this method is very much useful for the determination of pyridine in spirit (DNS). The requisite quantities of the DNS samples can be taken directly for the estimation of pyridine along with standards for colour development. By measuring absorbance of the colour developed at λ-max 362±1 nm, the corresponding concentration of pyridine can be found from calibration curve. Thus the method reported here can be used preferentially for the determination of pyridine in DNS and does not require any pre-treatment of the sample.

AKNOWLEDGEMENT

Author’s thanks are due to Director, Directorate of Forensic Science Laboratories, State of Maharashtra, India.

REFERENCES

  1. Habboush, A. E., Farroha, S. M. and Al-Bayat, R. I.; Chromatographia., 1978, 11, 662.
  2. Iskenderov, R. A., Ali-Zade, N. I., Bairamov, F. G. and Nagiev, T. M.; Zh. Anal. Khim., 1988, 43, 181 (Russ.).
  3. Zhadanov, B. V., Dobrakova, G. M. and Adamova, G. M.; Ref. Zh. Khim., 1977, 20, 19 GD.
  4. Rawat, J. P. and Bhattacharjee Priti; Indian J. Chem., Sect. A, 1976, 14, 544.
  5. Amlathe, S., Upadhyay, S. and Gupta, V. K.; Microchem. J., 1988, 37(2), 225.
  6. Ramchandran, K. N. and Gupta, V. K.; Microchem. J., 1991, 44 (3), 272.
  7. Indian Standard, Specification for Ordinary Spirit (Revised), Indian Standards Institution, New Delhi, 18:324, 1959, p.26.
  8. Land, E. and Lang, H. Z.; Analyt. Chem., 1976, 278, 368.

Figure 2 : Calibration curve for the determination of pyridine, Conc. of std. pyridine (μg/10ml) vs.  Absorbance measured at       λ-max 362±1 nm

Simultaneous Detection of Cardiovascular Drugs Clopidogrel and Aspirin in Combined Formulation by HPTLC

Arun G. Bhoi

Arun’s Institute of  Forensic Sciences, Research and Education, Pune -411 028 (India).

Email : arun.bhoi@gmail.com

(e-J. Foren. Crime Inv. 2011, 1, 1. Art. 2, 5th Jan. 2011)

ABSTRACT

Clopidogrel as clopidogrel bisulphate and aspirin drugs are prescribed in the combined dosage form on the cardiovascular disease. Both of these drugs are analysed using HPTLC (high performance thin layer chromatography). HPTLC glass plates (10 cm x 10 cm) pre-coated with silica gel 60F254 were used as stationary phase. Mobile solvent system was hexane : acetone (8:2 v/v) and UV detection carried at 254 nm. Clopidogrel and aspirin were detected at Rf-values 0.60 ± 0.02 and 0.25  ±0.02, respectively. The LOD for these drugs was found to be 100 ng per spot.

KEY WORDS : clopidogrel, aspirin, detection, cardiovascular, HPTLC, UV.


INTRODUCTION

Clopidogrel as clopidogrel bisulphate (Methyl-2-chlorophenyl-(4,5,6,7 tetrahydrothieno [3,2-c] pyridine – 5 yl) acetate bisulphate) and aspirin (acetyl salicylic acid, 2-acetoxy benzoic acid) are routinely used in the treatment of cardiovascular diseases. Aspirin works as anti-platelet, vasodilatory drug and also as weaker analgesic, anti-pyretic and anti-inflammatory [1]. Himani et. al. have studied susceptibility of clopidogrel bisulphate to acids, alkali, oxidation and heat using HPTLC [2]. Mitacos, A. and Panderi, I. have validated clopidogrel in pharmaceutical preparations using LC [3]. Aspirin in the presence of other drugs has been estimated using RP-HPLC [4,5,6], Rapid HPLC [7], HPTLC [8] and spectrophotometry [9]. Determination of clopidogrel has been reported in the literature using HPLC [10] and spectrophotometry [11]. Studies of clopidogrel bisulphate in combined form have been explored using HPLC [12,13,14,15]. Shrivastav et. al. [16] have validated clopidogrel bisulphate and aspirin drugs using RP-HPLC. Thus, heavy use and demand for cardiovascular drugs clopidogrel bisulphate and aspirin made it necessary to find easy method for its detection. HPTLC technique is explained here for the simultaneous detection of  this duo using simple, specific and speedy line up.

EXPERIMENTAL

Equipments:

The following material / equipment was used for the experiment.

  1. Merck, HPTLC glass plates pre-coated with silica gel 60 F 254 ( 10 cm x 10 cm).
  2. Camag Development Chamber ( small size, twin type ).
  3. Camag UV Viewing Chamber equipped with 254 nm and 366 nm wavelength exposure facility.

High Performance Thin-layer Chromatography (HPTLC):

Reagents: All reagents and solvents used were of analytical reagent grade.

95% ethyl alcohol and glass distilled water was used wherever required.

Standard Solutions:

Clopitab A 150 capsules, each  containing clopidogrel bisulphate powder equivalent to 75 mg of clopidogrel and aspirin in tablet form, two tablets of 75 mg each (i.e.150 mg of aspirin), marketed by LUPIN LTD., MUMBAI, INDIA, were used for studies.

  1. Clopidogrel Standard Solution ( 1mg/ml) : Clopidogrel bisulphate powder equivalent to 10 mg of clopidogrel was weighed from powder contents of capsule (Clopitab A 150), dissolved in small quantity of 95% of ethyl alcohol and made up to 10 ml with the 95% ethyl alcohol.
  2. Aspirin Standard Solution ( 1mg/ml) : Two tablets of aspirin were separated out carefully, from the contents of  Clopitab A 150 capsule, finely powdered and quantity equivalent to 10 mg of aspirin was weighed, dissolved in small quantity of 95% ethyl alcohol which was further made up to 10 ml using the same.

Camag, HPTLC glass plate pre-coated   with silica gel 60 F 254 of the size of 10 cm x 10 cm was taken for the experiment. 0.1, 0.2, 0.5, 1.0 and 2.0 μg quantities of each of the clopidogrel and aspirin standard solutions were spotted on the HPTLC plate using micro capillaries. The HPTLC plate was eluted in a previously saturated small sized, twin trough Camag HPTLC chamber using 5 ml quantity of  solvent mixture n-hexane : acetone ( 8 : 2 v/v). The solvent was allowed to travel to a height of     5 cm. Then the HPTLC plate was taken out, air dried and viewed in a UV chamber at 254 nm wavelength.

RESULTS AND DISCUSSION

The developed HPTLC plate when observed in the UV viewing chamber showed the presence of two spots by fluorescence quenching phenomenon. Aspirin showed its presence at Rf-value 0.25±0.02. The another constituent of Clopitab A 150 capsule, clopidogrel was found present at Rf-value 0.60 ±0.02. The solvent system used here for the detection of both the constituents of cardiovascular drug Clopitab A 150 shows very good separation from each other. The spots visualized are neither very close to the spotting line and solvent front nor farther away from these. The detection limit for both of these drugs ca. 100 ng. Further, it takes hardly 20 minutes to to complete the detection process. No clumber some technique is used herein. It (working set) can also, be used like a portable kit. Hence, HPTLC technique described here is a simple, specific and speedy one to detect drugs clopidogrel and aspirin separately or simultaneously in the medicinal formulations or biological samples.

ACKNOWLEDGEMENT

Author’s thanks are due to Director, Directorate of Forensic Science Laboratories, Mumbai, State of Maharashtra, India.


REFERENCES

[1] Tripathi K. D., Essentials of Medical Pharmacology, Third Edition, Reprint 1995, Jaypee    Brothers, Medical Publishers (P) Ltd., New Delhi, India.

[2] Himani Agarwal, Niraj Kaul, Paradkar A. R. and Mahadik K. R.;  Talanta, 2003, 61(5), 581-589.

[3] Mitakos, A. and Panderi, I.; J. Pharm. Biomed. Anal., 2002, 28, 431-438.

[4] Gandhimathi, M., Ravi, T. K., Abraham, A and Thomas, R.;  J. Pharm. Biomed. Anal., 2003, 32, 1145-1148.

[5] Shah, D. A., Bhatt, K. K., Mehta, R. S., Shankar, M. B., Baldania, S. L. and Gandhi, T. R.; Ind. J. Pharm. Sci., 2007, 69(4), 571-574.

[6] Shah, D. A., Bhatt, K. K., Mehta, R. S., Shankar, M. B., Baldania, S. L. and Gandhi, T. R.; Ind. J. Pharm. Sci., 2007, 69(4), 546-549.

[7] Sawyer, M. and Kumar, V. J.; J. Chromatogr. Sc., 2003, 4, 393-397.

[8] Bernard Fried and Joseph Sharma; Practical Chromatography, A Multidisciplinary Approach, CRC Press, 1996, p-242.

[9] Sena, M. M. and Poppi, R. J.; J. Pharm. Biomed. Anal., 2004, 34, 27-34.

[10] Juliana Sippel, Leticia L. Stair, El Frides E. S. Schapoval, Martin Steepe.; Journal AOAC International, 2008.

[11] Hala E. Zaa-Zaa, Samath, S. Abbas, M. Abdelkawy and Maha M. Abdelrahman.; Talanta, 2009, 78(3), 874-884.

[12] Pankaj K. Pacchadia, Ashish S. Doshi and Hitendra S. Joshi.; J. AOAC Int., 2009, 92(1), 152-157.

[13] Patel R. B., Shankar M. B., Patel, M. R. and Bhatt K. K.; J. AOAC Int.; 2008, 91(4), 750-755.

[14] Patel, R., Patel, M., Shankar, M. and Geetha, M, AAPS 2006-200789.PDF.

[15] Anadkumar K., Ayappan, Y., Raghu Raman V., Vetrichelvan T., Shankar A.S.K., Nagavalli, D.; Ind. J. Pharma. Sci. 2007, 69(4), 597-599.

[16] Shrivastava P. K., Basaiwal P. K., Jain Deepti and Shrivastava S. K.; Ind. J. Pharma. Sci.; 2008, 70(5), 667-669.


Identification of Impressions of Metal Marking Punches

Arun G. Bhoi

Arun’s Institute of  Forensic Sciences, Research and Education, Kale Padal, Pune – 411 028 (India).

Email : arun.bhoi@gmail.com

(e-J. Foren. Crime Inv. 2011, 1, 1. Art. 1, 1st Jan. 2011)

ABSTRACT

In this work physical characteristics studied to know whether engine and chassis numbers present on respective sites of  M/Cars are produced by the use of questioned punching nails or not ? The numbers present on the voucher plates (Questioned) comparatively studied with the test impressions produced by the questioned metal marking punches using microscopy. Imperfections, striations present thereon and its positioning at the ‘Clock-type Grid’ helped to correlate these.

KEY WORDS : punches, impression, digits, engine, chassis, number, clock-type grid, forensic.

INTRODUCTION

The M/Cars and the sets of metal marking punches used for punching digits were examined to know falsification in engine and chassis numbers, if any. The stamped impressions found on the various organs of vehicles such as engine, chassis and voucher plate were comparatively studied stamped impressions produced using questioned punches for their identity, individuality and similarity or dissimilarity. Microscopic examination was preferentially carried for doing this work.

EXPERIMENTAL

Physical Examination

The punched numbers – impressions (Questioned) were observed on the engine number site, chassis number site and voucher plate of the M/car vehicle. Being engine as a heavy – voluminous machinery and the chassis panel a long – one piece part of the vehicle, the punched numbers present on these were examined, in situ. Further, tracings of these numbers were taken on butter paper using soft graphite pencil. Supportingly, the numbers present at engine and chassis site were dusted with fine graphite powder and its images were lifted on the one inch broad transparent cellophane tape. Then, simulated (Test ) engine and chassis numbers were produced on 1mm thick  aluminum sheet using questioned metal marking punches. The tracings were taken, as also, the numbers were lifted on the cellophane tape.

Afterwards, the design and the shape of the “Questioned” and “Test” impressions were comparatively studied in situ and making use of tracings and lifted numbers present on cellophane tape. The dimensional parameters such as heights, widths, thicknesses, high-low joints of letters/digits, its spacing, length of script were minutely examined and the identity of the impressions of letters/digits was established. Overlaying of the tracings / lifted numbers of “Questioned” and “Test” letters/digits also helped to correlate these.

Microscopic Examination

Voucher plates were examined by this technique using “Metzer Comparison Microscope”. For this, voucher plates bearing punched Model No., Engine No., Chassis No. and Serial No. were removed from the cars. Further, the simulation impressions of the corresponding letters / digits were produced on 1mm aluminum sheet using the respective metal marking punches. Then, the impressions present on the impressions present on the voucher plate (Questioned) and the simulation impressions (Test) from the aluminum sheet were comparatively studied by keeping these on the moveable mounting stage of the microscope and using the illuminating light assembly. Because of the advantages of the good heights, widths and other characteristics the impressions of the higher case letters viz. “O”, “B” and “H” were selectively chosen for this examination.

Below discussed are some of the features used for correlating stamped impressions present on voucher plate and the test impressions of the higher case letters viz. “O”, “B” and “H”.

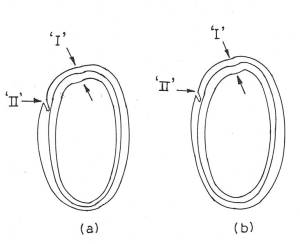
  1. Individual Characteristics : The higher case letter “O” (Questioned) shows the characteristic curve at position –I.           (Fig. 1 (a)). Similar curve has also been seen on the test impression (Fig. 1 (b)).

Figure 1 : Microscopic View of  :  (a)    Impression of higher case letter “O” from Voucher plate  (b)   Test Impression

2. Imperfections : The imperfection seen as on the impression of higher case letter “O” (Questioned) at position –II, has good identity with that of “Test” impression (Fig. 1 (a) and (b)). This imperfection has resulted by the crack/defect present in the punching nail itself.

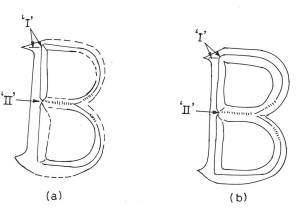
3. Irregularities in the Plateau: The higher case letter “B” is chosen for studying the irregularities in the plateau. The misalignment of plateau of terminus and that of upper helices is observed in “Questioned” impression of letter “B” at position “I” (Fig. 2 (a)). Also, at the site “II” (Fig. 2 (a)) the major irregularity (discontinuity) in the vertical leg is prominently noticed. These irregularities are also reproduced in “Test” impressions (Fig. 2 (b)).

Figure 2 : Microscopic View of  :  (a)Impression of higher case letter “B” from voucher plate  (b)Test Impression

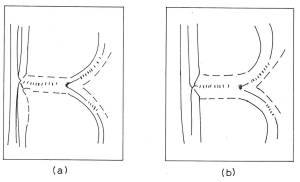
4. Identical Striations : On the middle arm of letter “B” the striations are seen sequentially produced (Fig. 3). “Questioned” and “Test” impressions show the linear consistency.  The unevenness in the thickness (shown by the dashed line “——-”) at some of the places of the running boundaries, arms and legs of the letters studied is because of the lack of the application of the uniform forces at the time of producing the respective impressions using punches.

Figure 3 : Microscopic View of leg and arm portion of higher case letter “B” showing striations

(a)Questioned Impression   (b)Test Impression

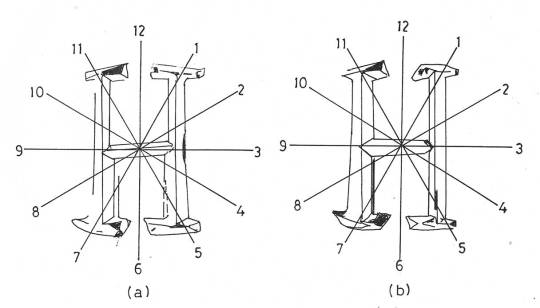
5. Clock-type Grid : Study of higher case letter “H” based on clock-type grid examination helps to correlate the “Questioned” and “Test” (Simulation) impressions and identifies the instrument / marking punch applied there so.

Figure  4 : Microscopic View of higher case letter “H” with marked ‘Clock – type Grid’ pattern.

(a) Questioned Impression from Voucher plate   (b) Test Impression

In Fig. 4, the ridges at the joint of the horizontal arm with the left leg at “9” – O’ clock position and the line running parallel to to this leg crossing the line of “7” – O’ clock position confirms the identity and the individuality of the stamping device. Furthermore, the plateau defects positioning in between “11” – O’ clock and “12”  – O’  clock, as also, the presence of plateau defect in “6” and “7” – O’ clock position supplements it. The deformities in the plateau or at terminals are usually the after effects of the continual/repeated use of the punches for stamping.

RESULTS AND DISCUSSION

By physical, dimensional and superimposition studies the impressions in  “Questioned” and “Test” (simulation) impressions of the punching nails under examination can be correlated. The parameters explained makes one enable to find the match between the corresponding impressions. These may, also, help to judge dissimilarities, if any, in the impressions to be compared. But these examinations are not full proof to decide the origin of the stamped impressions. However, the proper and careful evaluation of the comparative data and the critical features studied microscopically and use of ‘Type-clock Grid’ made it very much certain to say that the “Questioned” and the corresponding “Test” are derived by application of the same punches from the set. The individual characteristics, defects, irregularities observed in the respective ‘PUNCH’, differentiates / correlates it and its impression/s with the others. Thus by avoiding the possibility of the stamped impression  matching with the impression coming from such other punching nail manufactured from the same ‘HOB’.

ACKNOWLEDGEMENT

Author’s thanks are due to Director, Directorate of Forensic Science Laboratories, Mumbai, State of Maharashtra, India.